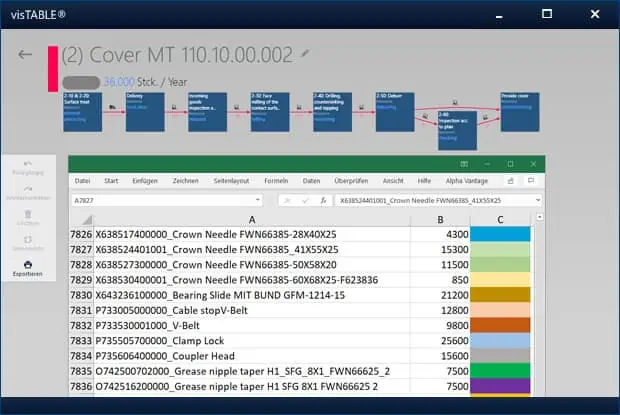
Value Stream Mapping Software

By using visTABLE® software, you can visualize the entire process. In manufacturing, value stream mapping helps identify waste by analyzing each step of material handling. The software allows to map the current state, apply lean principles to define the future state and to reduce the effort spent on non-value-adding processes. Improvement backed by VSM has never been easier.

Visualize your value streams with visTABLE® software

Lean thrives on visualization and transparency. Gain key figures about the current state. Based on the method of value stream mapping, the software helps to perform a logistics-oriented value stream analysis. Capture all of your value streams according to the line-back principle. The display of the map is automatic. If you add or remove processes or change transports, your VSM automatically adapts and maintains the optimal display. Provide your management with key figures on flow, value-adding processes and inventories.

Value Stream Mapping —
as simple as possible

Paperless modeling of value streams — save time and thus resources. In addition to capturing the value stream on the manufacturing shop floor, analysis is also possible by importing existing data. The software calculates the lead time based on your process description, cycle time and inventory specification. Combine process and logistics in one overview — for all product families. Create multiple value stream maps and visualize the resulting flow with this VSM software. Your benefit lies in the clear presentation of comprehensive information of all logistics processes.

Create value stream mapping by importing ERP-data.

Value Stream Design — collaborate within your team

A process runs optimally when material flow and information flow mesh perfectly and when you position resources in a process-oriented manner. Use the value stream map to design your supply chain, matching the customer demand. Involve experienced people, since designing the future state value stream map could be vastly cross-functional. visTABLE® software makes Value Steam Design a simple and understandable process. Collaborate across departments for maximum efficiency with built-in tools to define processes, takt time, cycle times and non-value-added work for the future state map.

Better understand changes of your Value Stream

With visTABLE® you bring your Lean initiatives into the age of Industry 4.0. The software integrates manufacturing, assembly, logistics and represents the material flow right within your layout. By digitally mapping the value stream, you place it in the context of your production layout. Fast and intuitive work on VSM, design and implementation of Kaizen through touch-optimized input. Analyze and evaluate measures in real time. This way, you integrate all process participants.

CUSTOMER STORY on VALUE STREAM MAPPING SOFTWARE

„In this way, processes can be documented as a value stream oriented representation and as the basis for a subsequent layout evaluation at the push of a button.“

Michael Feldmeth, Project Manager @ Staufen AG

1. VSM of the current state

Paperless modeling of value streams. Fast and intuitive work via touch or on the desktop with mouse and keyboard. Import of transaction data, transport orders or parts lists via Excel interface makes inventory data manageable. Once the details are clearly laid out by Value Stream Mapping, you can easily identify improvements. Provide a common language for your team as you map your processes.

2. Visualize and analyse

With the direct reference to the layout, you generate impressive added value compared to traditional approaches of Value Stream Mapping. Evaluate Lean KPIs like lead times, inventories, process times, transport effort and distances. Use our method and Value Stream Mapping software to illustrate the flow of raw materials and optimize information flow to transform your manufacturing into a true Lean system.

3. Make the future state tangible

Integrate all process participants and thus promote teamwork to implement continuous improvement with full transparency. Design and experience the future state map of your own production structures in a digital three-dimensional layout model. A well-constructed value stream map can create universal understanding of your workflows.

4. Working on the overall picture

Combine all value streams into a complete value chain. The software takes dependencies into account and makes interrelationships transparent. Taking a Lean perspective means working on the overall picture, not just on individual manufacturing processes. Value Stream Mappings with visTABLE® is that easy. It combines diagramming, data visualization, and collaboration to improve and design your manufacturing company and paves the ultimate goal of Operational Excellence.

5. The value stream as the basis for lean layout

Value stream mapping helps to create a map that represents everything that is required to get a product from raw material into the hands of your customer. This ramp-to-ramp view focuses on the essential flow systems of the factory. This holistic view according to lean criteria increases the planning quality and significantly accelerates the planning process. Instantly present your lean ideas to any audience and share your suggestions with team members, employees, managers, and executives.

Frequently Asked Questions

The software creates full transparency of your production and logistics processes. Instead of putting countless value streams on paper, preparing them for management and then implementing the measures again in other tools, you create a digital image with the app right from the start. And this in the simplest way possible. You combine easy accessibility with all the advantages of digitization. Information silos in the company are finally a thing of the past.

Yes. Even complex value streams can be captured intuitively and displayed at different levels of detail or value stream sections. All this information flows together in a common model. Mapping material flows and transports, they become transparent in the layout to everyone involved. This means that you always have everything in view. Changes to individual value streams become traceable. Your cross-functional teams recognize interrelationships. An innovative improvement concept becomes applicable, accelerating lean transformation and paving the way to efficient processes in production and logistics.

The map can be created directly on the shop floor. The simple intuitive operation enables value creating processes, logistics, supply chains, inventories, and cycle times to be recorded in a short time. Data can be transferred from IT systems via a standardized Excel interface. The software offers a clear visualization and displays the material flow in the layout. In this way, waste, added value, transports of material or final products, movements and walking routes of employees become comprehensible for everyone.

The software offers a wide range of options for transferring data from other systems. A standardized Excel interface is available to use ERP, merchandise management system or information from process mining.

You capture logistics and processes with boxes and arrows that symbolize transports. A triangle represents inventory. Individual adjustments of the symbol designs are not possible; this keeps the display compact and makes it easier to use. Information flows can also not be recorded; the data collection focuses on the material flow.

This is not necessary at all. visTABLE® always contains all available functions. You don’t have to order anything extra or have it activated; one tool to integrate value stream map and layout according to lean thinking.

Wherever processes have to be analyzed, lean logistics implemented and layouts planned, visTABLE® is used. This is how you get out of the silos. Because visTABLE® supports systematic layout planning and focuses on a factory planning model that is consistently oriented towards lean thinking. In this way, you pave the way to lean and adaptable manufacturing. We support various scenarios in assembly, in the warehouse, in the integration of interlinked plants, as well as hall, and site planning.

Still unsure? Deepen your knowledge.